
Volumetric Waterfall 3D Chart and PointMarkers
Examples for the Waterfall 3D Chart can be found in the SciChart WPF Examples Suite which can be downloaded from the SciChart Website or our SciChart.WPF.Examples Github Repository.
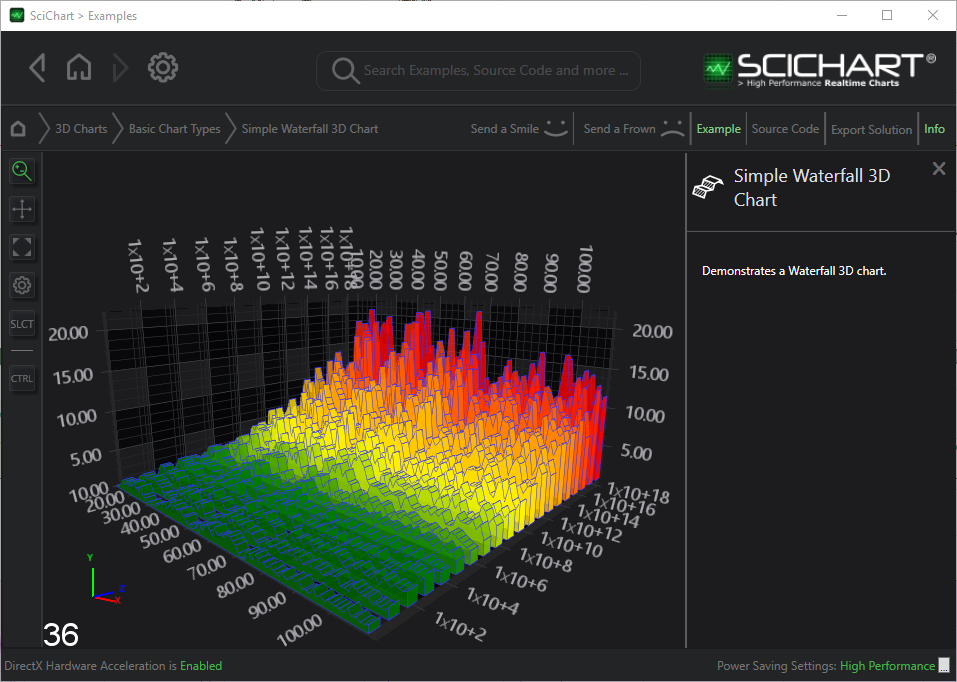
Volumetric Waterfall and PointMarkers
A Waterfall Chart can be made volumetric by setting the property WaterfallRenderableSeries3D.SliceThickness (default value = 0).
Point Markers may be added to the data-points by setting the WaterfallRenderableSeries3D.PointMarker property.
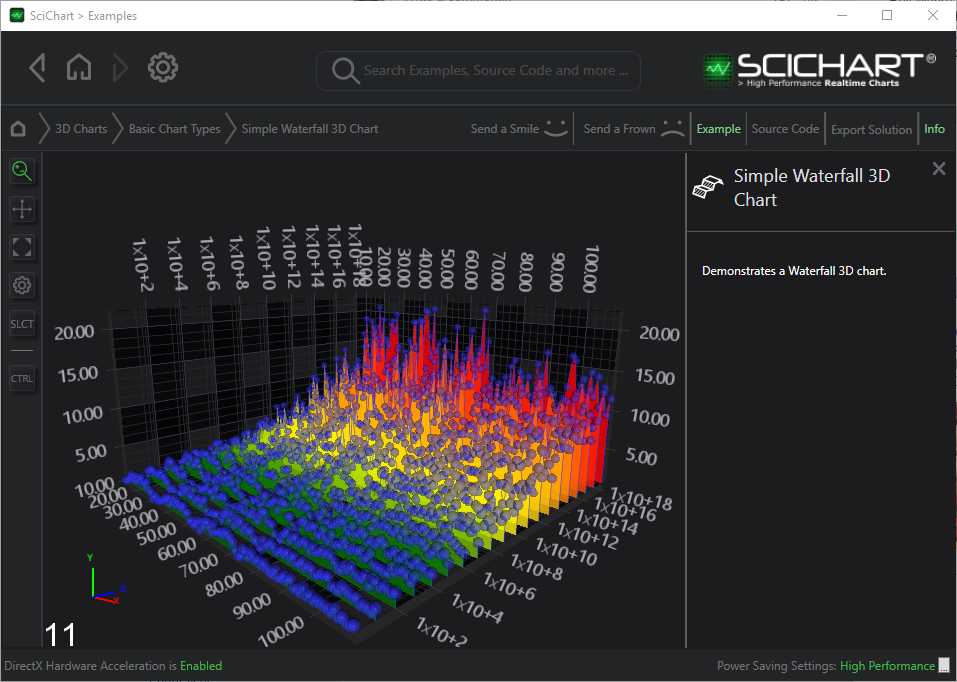
Examples of both of these can be found in the SciChart WPF Examples Suite under 3D Charts > Basic Chart Types > Simple Waterfall 3D Chart
See Also